
Every time you pick up a packaged food item from a supermarket shelf, you are confronted with a nutrition label containing rows of numbers, percentages, and terms that can feel more confusing than helpful. For most consumers, the nutrition facts panel remains an inscrutable grid that gets glanced at briefly before being set aside in favor of more intuitive cues like brand recognition, price, or packaging design. Yet the nutrition label is one of the most powerful tools available for making informed dietary choices, and understanding how to read it correctly can transform your relationship with packaged food.
India introduced its own mandatory food labeling regulations through the Food Safety and Standards Authority of India (FSSAI), requiring packaged food manufacturers to disclose nutritional information on labels. Despite this, consumer literacy around label reading remains low, and manufacturers have sometimes used label design to obscure unfavorable nutritional information or emphasize misleading health claims. Learning to read beyond the front-of-pack marketing claims and engage critically with the actual nutrition panel empowers you to make genuinely informed purchases rather than being guided by advertising language.
The skill of label reading is relevant not only to weight management but to virtually every health concern: managing blood sugar, reducing sodium intake, avoiding hidden allergens, limiting ultra-processed ingredients, and understanding what you are actually consuming versus what the packaging implies. This guide provides a systematic framework for reading and interpreting nutrition labels correctly, from understanding serving sizes to decoding ingredient lists and identifying the hidden sugars and fats that undermine nutritional quality.
Whether you are managing a health condition, trying to eat more mindfully, or simply wanting to understand what enters your body, the time you invest in developing label literacy is one of the most practical and transferable skills in modern nutrition.
Start with Serving Size: The Most Important Number on the Label
The single most important piece of information on any nutrition label is the serving size, yet it is also one of the most commonly misread or ignored. All nutrient values listed on the label apply to the stated serving size, not to the entire package. If a bag of chips lists a serving size as 30 grams containing 150 calories, and the package contains 90 grams, eating the entire package delivers 450 calories, not 150.
Manufacturers often set serving sizes to make products appear healthier or lower in calories than typical consumption amounts would suggest. A serving of two cookies that contains 120 calories seems manageable until you recognize that most people eat four to six cookies in a sitting, consuming 240 to 360 calories. This gap between listed serving size and actual consumption amount is one of the primary mechanisms by which labels can mislead even attentive consumers.
FSSAI regulations in India specify that serving sizes should be based on Reference Amounts Customarily Consumed, but enforcement and standardization remain imperfect. When evaluating any packaged food, your first step should be to identify the serving size, assess whether that serving size corresponds to what you will actually eat, and then calculate the actual nutrient amounts you will consume based on your realistic portion.
A useful practice is to check how many servings are in the entire package by dividing total package weight by the serving size. This immediately tells you how many times to multiply all the nutrients listed to understand the full package’s nutritional contribution. For items you are likely to consume entirely in one session, the full package is your effective serving.
Understanding Calories and Energy
The calorie count per serving tells you how much energy the food delivers. In India, energy is expressed in kilocalories (kcal), which are the same as the Calories used in everyday conversation. The calorie content of a food influences how it fits into your overall daily energy balance, though calorie counting is neither the only nor always the most meaningful approach to dietary quality.
Calories are derived from macronutrients: protein provides 4 kcal per gram, carbohydrates provide 4 kcal per gram, fat provides 9 kcal per gram, and alcohol provides 7 kcal per gram. This means that foods high in fat are calorie-dense by volume, while foods high in water and fiber tend to be lower in calories for their physical size. Understanding this relationship helps explain why nuts, oils, and processed snacks are energy-dense while vegetables, fruits, and legumes tend to be relatively lower in energy for comparable volumes.
Rather than treating all calories as equivalent, it is more useful to consider the nutrient density of a food alongside its calorie content. A 200-calorie serving of almonds delivers protein, healthy fats, magnesium, and fiber. A 200-calorie serving of a packaged sweet snack may deliver primarily sugar and refined starch with minimal supporting nutrition. Both are 200 calories, but their nutritional value and effect on appetite, blood sugar, and long-term health are very different.
Decoding Macronutrients: Carbs, Protein, and Fat
The macronutrient section of the label breaks down total carbohydrates, dietary fiber, sugars, total fat, saturated fat, trans fat, and protein. Understanding each of these components and what their values mean in the context of your diet requires looking beyond the raw numbers.
Total carbohydrates include all forms: dietary fiber, naturally occurring sugars, added sugars, and starches. Fiber is listed as a sub-category of total carbohydrates and should be sought actively because it supports digestive health, blood sugar stability, and satiety. A food with 25 grams of total carbohydrates but 8 grams of fiber has an effective glycemic load substantially lower than its total carbohydrate count suggests. Aim for products that provide at least 3 grams of fiber per serving, and treat high-fiber content as a positive nutritional signal.
Sugars listed include both naturally occurring sugars such as those in fruit and dairy and added sugars. FSSAI labels now increasingly require added sugar disclosure separately from total sugars. Added sugars are those incorporated during processing beyond what was naturally present, and they provide energy without accompanying nutrients. The WHO recommends limiting added sugars to less than 10 percent of total daily energy intake, with further benefits below 5 percent. Seeing high added sugar content is a signal for caution regardless of how the product is marketed.
Protein content should be evaluated alongside the amino acid completeness question, particularly for vegetarians. Plant proteins such as those in legumes, grains, and soy are incomplete individually but become nutritionally complete when consumed across a varied daily diet. The protein listed on labels reflects total protein weight but not its digestibility or amino acid profile, which are important considerations for those relying on plant foods as primary protein sources.
Fat Quality Matters More Than Total Fat Quantity
The era of low-fat dietary guidance has given way to a more nuanced understanding that fat quality is far more relevant to health outcomes than total fat quantity. The label breaks down fat into saturated fat, trans fat, and sometimes monounsaturated and polyunsaturated fats. Understanding these distinctions matters for making informed choices.
Saturated fat, found predominantly in animal products and tropical oils including coconut and palm oil, has traditionally been associated with cardiovascular risk, though the evidence has become more complex and context-dependent in recent research. FSSAI guidelines recommend keeping saturated fat intake below 10 percent of total daily energy. A product with high saturated fat as a proportion of its calories warrants attention, particularly when consumed regularly in significant amounts.
Trans fat deserves particular concern. Industrially produced trans fats, created through partial hydrogenation of vegetable oils, are associated with elevated cardiovascular risk even at low intake levels. Many countries including India have moved toward banning or severely limiting artificial trans fats in the food supply. If a label shows any amount of trans fat per serving, it is worth noting that accumulated exposure from multiple products using similar oils can add up despite individual amounts appearing small. Reading the ingredient list for “partially hydrogenated” oils is the clearest way to identify trans fat sources.
Unsaturated fats, particularly omega-3 fatty acids found in oily fish, flaxseeds, and walnuts, are generally considered beneficial. Products containing meaningful amounts of monounsaturated or polyunsaturated fats with low saturated fat content tend to offer a better fat quality profile than those dominated by saturated or trans fats.
The Ingredient List: Where the Full Story Is Told
The ingredient list is in many ways more informative than the numerical nutrition panel because it reveals what was actually used to make the product, in descending order by weight. Ingredients present in the largest amounts appear first, and those in smallest amounts appear last. Reading the ingredient list alongside the nutrition facts panel gives a complete picture of food quality that neither provides alone.
A useful rule of thumb is the five-ingredient guideline: the fewer and more recognizable the ingredients, the closer the product is to whole food and the less processing has occurred. This is not an absolute rule but a helpful heuristic. When the ingredient list runs to twenty or thirty items, many with names that require chemistry knowledge to recognize, the product has undergone extensive processing that typically reduces nutritional quality relative to the whole foods from which it was derived.
Look for whole grain as the first ingredient in bread, crackers, and cereal products. If refined flour appears before whole grain flour, the product is primarily refined grain despite any “made with whole grains” claim on the front of the package. Similarly, look for actual fruit or vegetable components in products claiming to contain these ingredients, rather than fruit juice concentrates or fruit flavor, which are processed derivatives with different nutritional properties.
Understanding the Daily Value Percentages
Each nutrient on the label typically appears alongside a percentage daily value, which indicates how much of the recommended daily intake of that nutrient a single serving provides. These percentages are calculated based on a standardized 2,000 calorie daily diet, which may or may not correspond to your individual needs.
A general guideline is that 5 percent daily value or less indicates a low source of that nutrient, while 20 percent or more indicates a high source. This rule applies equally to nutrients you want more of, such as fiber, vitamins, and minerals, and to those you want less of, such as sodium, saturated fat, and added sugar. A food providing 5 percent of sodium is a low-sodium food, while one providing 30 percent is a high-sodium food that, if consumed multiple times daily alongside other sodium-containing items, can easily push total intake beyond recommended limits.
Vitamins and minerals listed on the label may include vitamin A, vitamin C, calcium, iron, and others depending on the product category and regulatory requirements. Seeing these represented at meaningful daily value percentages indicates that the product contributes usefully to micronutrient intake beyond its macronutrient content.
Hidden Sugar: Identifying Its Many Names
One of the most practically useful label-reading skills is the ability to identify added sugars across their many different names in ingredient lists. Manufacturers sometimes use multiple different sugar ingredients in a single product, which has the effect of keeping each individual sugar ingredient lower on the ingredient list despite the product being effectively high in total sugar.
Added sugars appear under names including sucrose, glucose, fructose, maltose, dextrose, corn syrup, high-fructose corn syrup, maltodextrin, cane sugar, beet sugar, evaporated cane juice, agave nectar, honey, molasses, fruit juice concentrate, barley malt extract, and many others. When multiple forms of sugar appear in the ingredient list, their combined contribution to total added sugar intake is additive regardless of their individual positions in the list.
Products marketed as “natural,” “healthy,” or “wholesome” are not exempt from this scrutiny. Many products using honey, agave, or fruit juice concentrate as sweeteners market themselves as free of refined sugar while providing equivalent caloric and glycemic contributions from alternative sugar sources. From a nutritional standpoint, the added sugar content matters more than the specific form of sugar used.
Sodium: India’s Underappreciated Dietary Challenge
Sodium intake in India has risen substantially with the expansion of packaged and ultra-processed food consumption. The WHO recommends limiting sodium intake to under 2,000 milligrams per day, which corresponds to approximately 5 grams of salt. Research suggests that many urban Indians consuming packaged foods regularly substantially exceed this recommendation.
The sodium listed on nutrition labels accounts for sodium from all sources in the product including salt, sodium-containing preservatives, flavor enhancers such as monosodium glutamate, leavening agents, and other functional additives. Foods to scrutinize particularly closely for sodium include packaged savory snacks, instant noodles, ready-to-eat meals, processed meats, cheese, pickles, sauces, and condiments.
A single serving of some packaged snack products can contain 400 to 600 milligrams of sodium, representing 20 to 30 percent of the daily recommended limit. When such products are consumed at multiple meals alongside other sodium-containing foods, exceeding the daily limit becomes easy without any obvious sensation of eating heavily salted food because the salt is distributed throughout the product’s texture.
Front-of-Pack Claims: Marketing vs. Reality
Front-of-pack health claims, certifications, and marketing language are often the first things consumers notice on a product, and they are specifically designed to create positive associations that may or may not reflect the product’s actual nutritional quality. Understanding how to evaluate these claims against the actual nutrition panel prevents marketing language from overriding nutritional judgment.
Terms like “multigrain” indicate that multiple grains were used but say nothing about whether those grains were whole or refined. A multigrain product with refined wheat flour as the primary ingredient is not meaningfully more nutritious than a single-grain refined wheat product. “Natural flavors” on an ingredient list indicates that the flavoring was derived from natural sources but reveals nothing about whether the product overall is minimally processed or nutritious. “No artificial colors” simply means synthetic dyes were not added, without implying anything about the product’s overall nutritional quality.
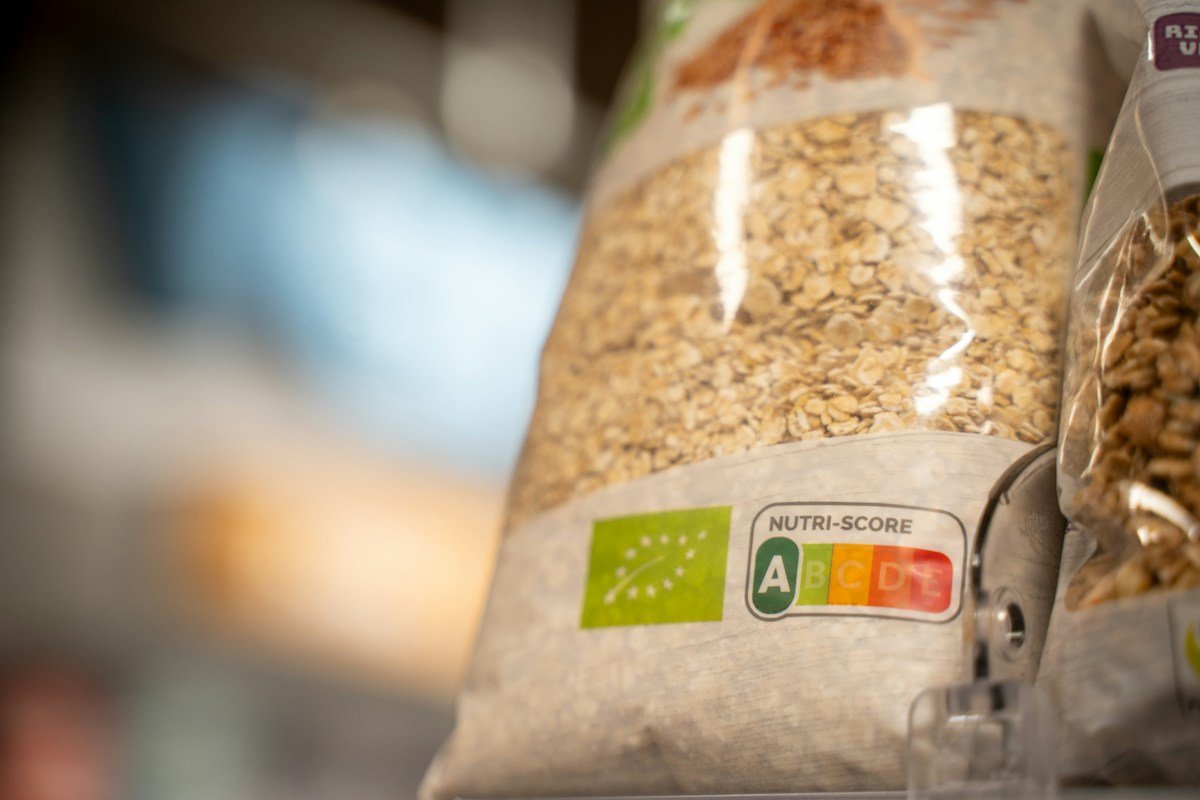
Health star ratings, traffic light labeling, and other summary systems appearing on packaging in various markets provide some help but have limitations based on how nutrients are weighted in their formulas. The most reliable approach remains reading the full nutrition panel and ingredient list rather than relying on any single summary symbol or claim.
Nutrition Label Elements Comparative Reference Matrix
The following matrix summarizes the key components of a nutrition label, what to look for in each section, and the practical guidance for interpreting the values in the context of healthy eating decisions.
| Label Element | What It Means | What to Look For | Red Flags |
|---|---|---|---|
| Serving Size | Unit all values apply to | Compare to actual portion you eat | Very small serving sizes |
| Calories | Energy per serving | Nutrient density vs calories | High calories, low nutrients |
| Total Fat | All fat types combined | Type of fat matters more | High saturated + trans fat |
| Trans Fat | Hydrogenated oil content | Should be zero ideally | Any amount listed |
| Carbohydrates | Total carbs incl. fiber + sugar | High fiber, low added sugar | High sugar, low fiber |
| Added Sugars | Sugar added in processing | Minimize, below 5g/serving | Over 10g per serving |
| Protein | Protein content per serving | High protein for satiety | Less than 3g in a “protein” product |
| Sodium | Salt equivalent content | Below 140mg per serving is low | Over 600mg per serving |
| Dietary Fiber | Indigestible plant material | Seek 3g or more per serving | Less than 1g in grain product |
| Ingredient List | All components by weight | Short, recognizable ingredients | Sugar as 1st-3rd ingredient |
* Guidelines are general and context-dependent. Overall dietary pattern matters more than individual product decisions.
This matrix provides a quick reference framework that you can apply mentally while standing in a grocery aisle, making the label-reading process faster and more systematic as it becomes habit.
Frequently Asked Questions About Reading Nutrition Labels
What should I look at first on a nutrition label?
Start with the serving size to understand the reference point for all other values. Then look at the calories to understand the energy density, check total sugars and added sugars to identify sweetened products, examine dietary fiber to assess whole grain and plant content, and review sodium to identify high-salt items. The ingredient list should always be read alongside the numbers panel for a complete picture.
Is the percent daily value useful for everyone?
Percent daily values are based on a standardized 2,000 calorie diet, which is an average estimate that may not match your actual calorie needs. Children, very active individuals, pregnant women, and people with specific health conditions all have different needs. Use the daily value percentages as a rough guide rather than a precise personal calculation, focusing on relative comparisons between products rather than absolute adequacy assessment.
How many grams of added sugar per day is too much?
The WHO recommends that added sugars contribute less than 10 percent of total daily energy, with further health benefits when kept below 5 percent. On a 2,000 calorie diet, this translates to less than 50 grams per day, with an ideal target below 25 grams. Many packaged foods contribute significantly to this total even in single servings, making cumulative tracking valuable for those managing sugar intake.
What does “multigrain” actually mean?
Multigrain simply indicates that more than one type of grain was used in the product. It says nothing about whether those grains were whole or refined. A product can be multigrain and still be made predominantly from refined flours. To confirm whole grain content, look for whole grain listed as the first ingredient and check the fiber content, as whole grain products typically provide at least 2 to 3 grams of fiber per serving.
Are natural flavors better than artificial flavors?
From a nutritional standpoint, neither natural nor artificial flavors contribute meaningful nutrients. Both are added primarily for taste modification. The distinction of “natural” refers to the source of the flavoring compound rather than its safety or healthfulness. A product using natural flavors is not inherently more nutritious than one using artificial flavors, though some consumers prefer to avoid synthetic compounds for other reasons.
How can I tell if a product has hidden fats?
Check the ingredient list for oils, shortenings, butter, cream, coconut milk, and partially hydrogenated oils, which indicate added fat sources. A product that seems low in total fat based on numbers may still contain unfavorable fat types that are listed below the threshold of individual reporting. Looking at the saturated fat and trans fat sub-categories within the fat section of the label reveals fat quality beyond total fat quantity.
Should I avoid all high-calorie foods?
Not necessarily. Calorie density should be evaluated in the context of nutrient density. Nuts, seeds, avocados, and whole grain products can be calorie-dense but also nutrient-dense, providing significant vitamins, minerals, healthy fats, and fiber alongside their caloric contribution. Ultra-processed foods that are calorie-dense but nutrient-poor present a different situation from these whole food alternatives. The distinction is important for making balanced, health-conscious choices rather than avoiding calorie-dense whole foods unnecessarily.
How reliable are FSSAI nutrition labels in India?
FSSAI has progressively strengthened labeling regulations, requiring disclosure of key nutrients and imposing restrictions on health claims. However, regulatory enforcement and manufacturer compliance vary, and some smaller brands may not fully meet current requirements. For large, established brands, labels are generally reliable. Cross-checking label information against the ingredient list can reveal inconsistencies. Ongoing FSSAI initiatives are working toward front-of-pack mandatory warning labels for products high in sugar, salt, and saturated fat, which will further improve label informativeness.
Medical Disclaimer: The information in this article is for educational and informational purposes only and is not intended as medical advice. Always consult a qualified healthcare professional before making any changes to your diet, lifestyle, or health routine. Individual results may vary.
Making Label Reading a Practical Daily Habit
The goal of developing label literacy is not to become anxious about food choices or to spend an excessive amount of time in every grocery aisle conducting detailed nutritional analysis. Rather, it is to build enough understanding that you can quickly identify genuinely nutritious products from those that are nutritionally poor despite appearing healthy through their packaging and marketing.
With practice, the essential elements of label reading become automatic: checking serving sizes, scanning the ingredient list for whole food components, looking at fiber and added sugar content, and identifying suspicious marketing claims. As you build this habit, you develop a reliable internal framework that supports healthier purchasing decisions without requiring intensive effort at each encounter.
For further reading, visit the NIH Office of Dietary Supplements, USDA FoodData Central, National Institute of Nutrition India, WHO Nutrition, Harvard Nutrition Source, and ICMR India.